Ever wondered how the data sent from your flight simulator to VATSIM or IVAO and back looks like? That’s an easy one, since both networks rely on the FSD (flight sim daemon) software and its quite primitive plain text protocol. Let me show you in a few quick steps how to analyse the network traffic with the help of Wireshark.
What is Wireshark? Simply put, “Wireshark is a free and open-source packet analyzer. It is used for network troubleshooting, analysis, software and communications protocol development, and education.” (wp) Educate ourselves, we will. Let’s go…
Get and Install Wireshark
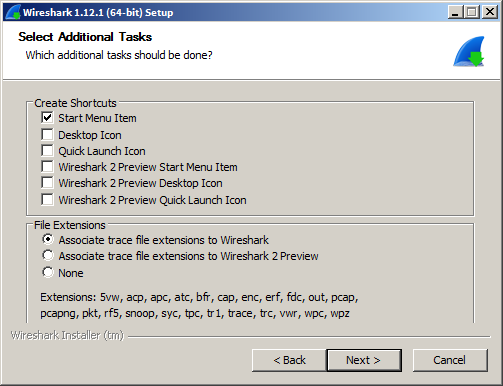
On Linux this is easy enough, I don’t have to tell you, right? For Windows go to Wireshark.org and download the recent stable release. I use version 1.12.1. Then do the usual install steps as with any other software installer. At some point it will ask you, “which additional tasks should be done?” We don’t want to beta test the Version 2 Preview, so this is what I chose:
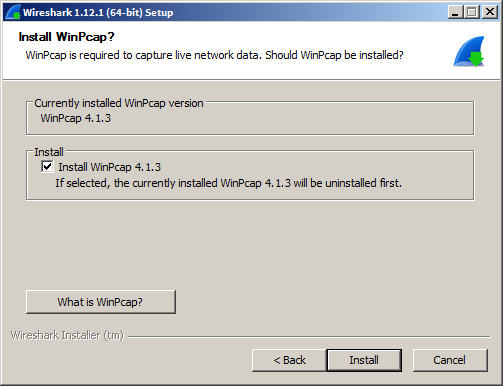
Later it will ask you to “Install WinPcap?” Yes, we want that, since WinPcap (or other versions of Pcap on other platforms) is the network driver that does the dirty work. (Win-)Pcap is mandatory. This is how my screen looks like on an upgrade-install. Your’s will differ slightly as you are installing from scratch.
After installing, fire up Wireshark and you will be presented with the main GUI. Don’t be too intimidated by all the weird stuff. You can’t break anything here and remember: This is for education. So play around if you feel like it!
For the sake of this quick howto, let’s focus on the FSD stuff, though.
Create a Capture Filter for FSD Protocol
First let’s create a “capture filter”. Remember Pcap does the dirty work? With a capture filter we can tell Pcap which packets it should capture instead of filtering all the data in the Wireshark GUI later on. That saves a lot of CPU ressources, the GUI will respond way faster, is less confusing and most importantly, it will not capture all the other data that concurrently runs through your internet connection (Teamspeak, WWW, Youtube, …).
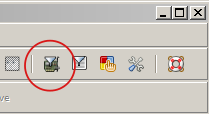
Click on that network card / funnel symbol in the tool bar.
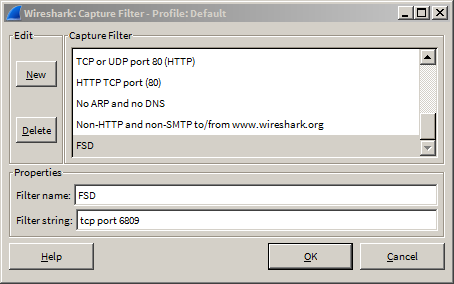
Then click on “New” and fill in FSD as “Filter name” and fill in tcp port 6809 as “Filter string”
Start a Capture Session
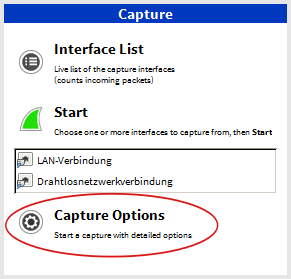
In the “Capture” widget in the main window click on “Capture Option”.
As we want to use our capture filter, we want to “start a capture with detailed options.”
Find your network interface that connects your computer to your internet router. The interface name should be familiar or maybe you know your internal IP address that interfaces to your internet router. If you can’t tell which is the right one, go back and click on “Interface List”, generate some bulk traffic and watch the packet counter.
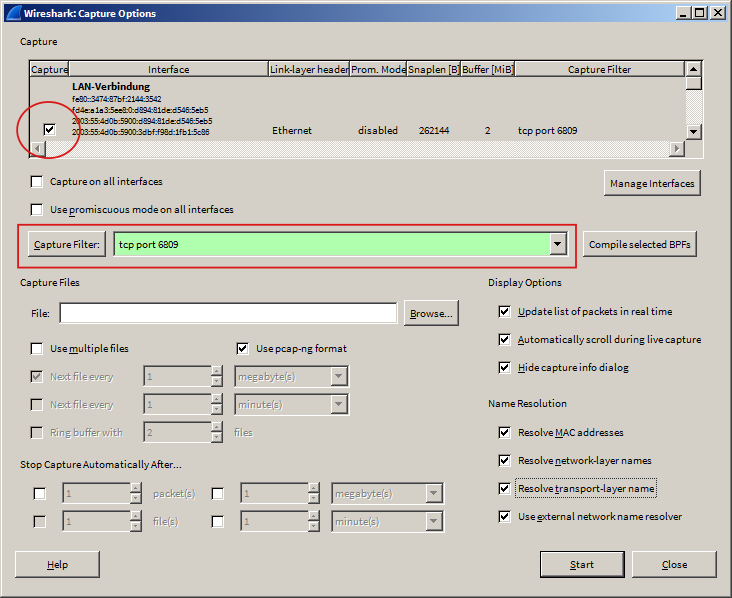
After you check-marked the capture interface, click on “Capture Filter” and choose our “FSD” filter, that we have created before. This should put the raw filter text into the text field next to it. All the other options are less important. I prefer not to use “promiscuous mode” and enable all name resolutions in sessions like this. You can specify a file for the output here already. If you want to create a network dump file in order to send it in for support at VATSIM or IVAO, you may consider doing so here. In any case, you will have the option to save the session into a file later.
Hit “Start” and Wireshark with a filtering pcap under its hood will start capturing the data and will simultaneously show all packets it sees in real time in the GUI.
Analyse the Data
The table of packets that are flowing by seems confusing at first. Let’s get something nice to look at. The connection from vPilot, (X-)IvAp, (X)SquawkBox or whatever client you use to the FSD server from VASTIM / IVAO is one single TCP connection or TCP Stream. Wireshark can show you the plain text interchange between client and server (remember: FSD is a plain text protocol) of such a TCP stream in a nicely coloured overview.
Right click on any packet row and choose “Follow TCP Stream” from the context menu. It should show you something similar to this:
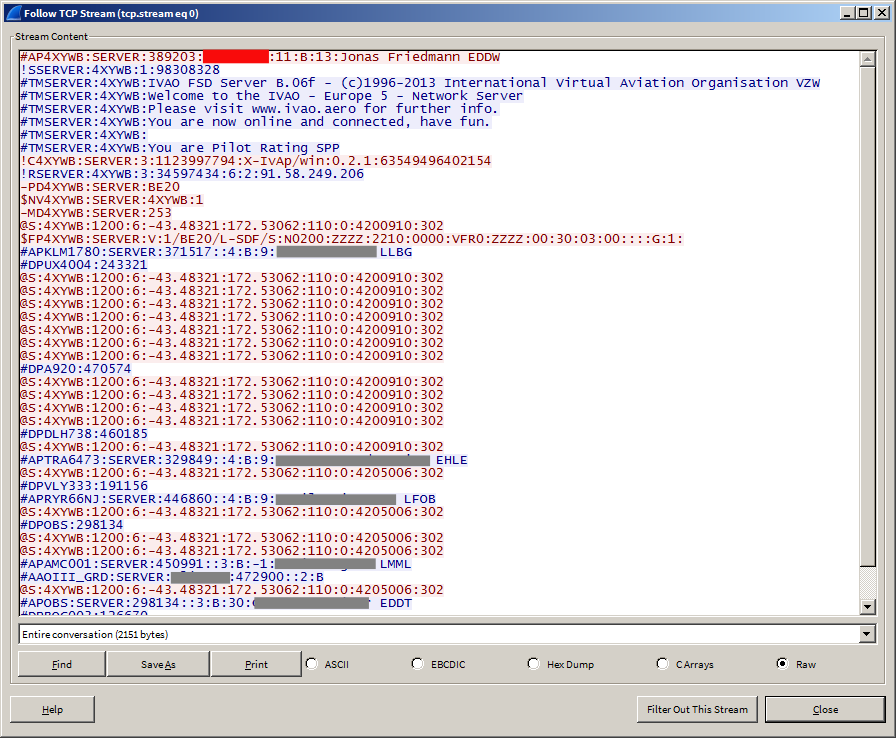
Each message that your client sends to the server and vice versa is a line of text. The lines sent from your client to the server appear in red, the lines from the server to your client appear in blue. That’s nice, huh?
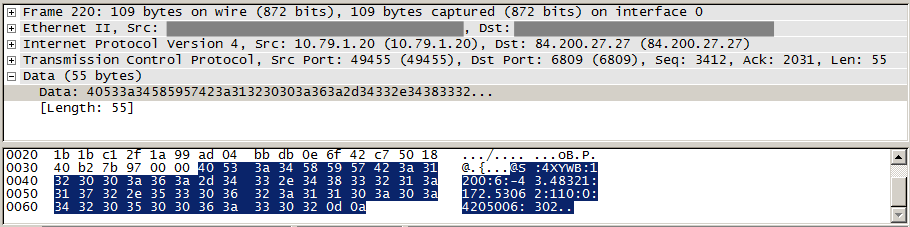
Let’s dig a tad bit deeper. Pick one of the packets from the table. In the second last window on the bottom you can expand each layer of the internet protocol packet. Some packets are just acknowledgements that don’t tell much, but if you hit one with actual pay load, you can expand the “Data” layer. If you then click on the “Data: ….” row, Wireshark will mark the bytes that represent the data payload in the lowest window in blue color. In my example you can see that the message starts with @S: (text) and ends with 0d 0a (bytes). The last two bytes signify carriage return and line feed (i.e. end of line mark).
Conclusion and some Warnings
You can’t break anything here. Wireshark/pcap is only listening and won’t inject or manipulate any data on the wire. Do whatever you feel like doing here. But remember, that this is not just your data. You will sniff a lot of data from other people who use the network as well, so tread it respectfully.
If you want to send this data to VATSIM or IVAO for technical support, ask how you should do that. You should definitely compress it with 7zip or any other archiver. Publishing it on a public web site or forum is not a good idea, since personal data from other people is inevitably included. Also your own password is included in plain text. In the above screen shot I have obfuscated my password with a red box. If you connect to the network first and then start the capture session, the password will not be included (it is sent only once).
This setup runs very low on CPU usage and does not produce much data on disk. You can safely capture all the FSD data of 12 hours long haul flights without any problems.
Have fun!